
01 · Live analytics
Live dashboards with channel attribution
Total revenue, by ticket type and by channel. Cross-event sales curve, live checkout conversion rate, per-minute sales during launches. End-to-end attribution from click to ticket sold.
Data Analytics · Real-time reporting
Follow sales, online and box-office stock, attribution across configured channels and entry pace from your phone. Refresh targets are defined by volume and integration.
Make decisions with live data, not intuition.
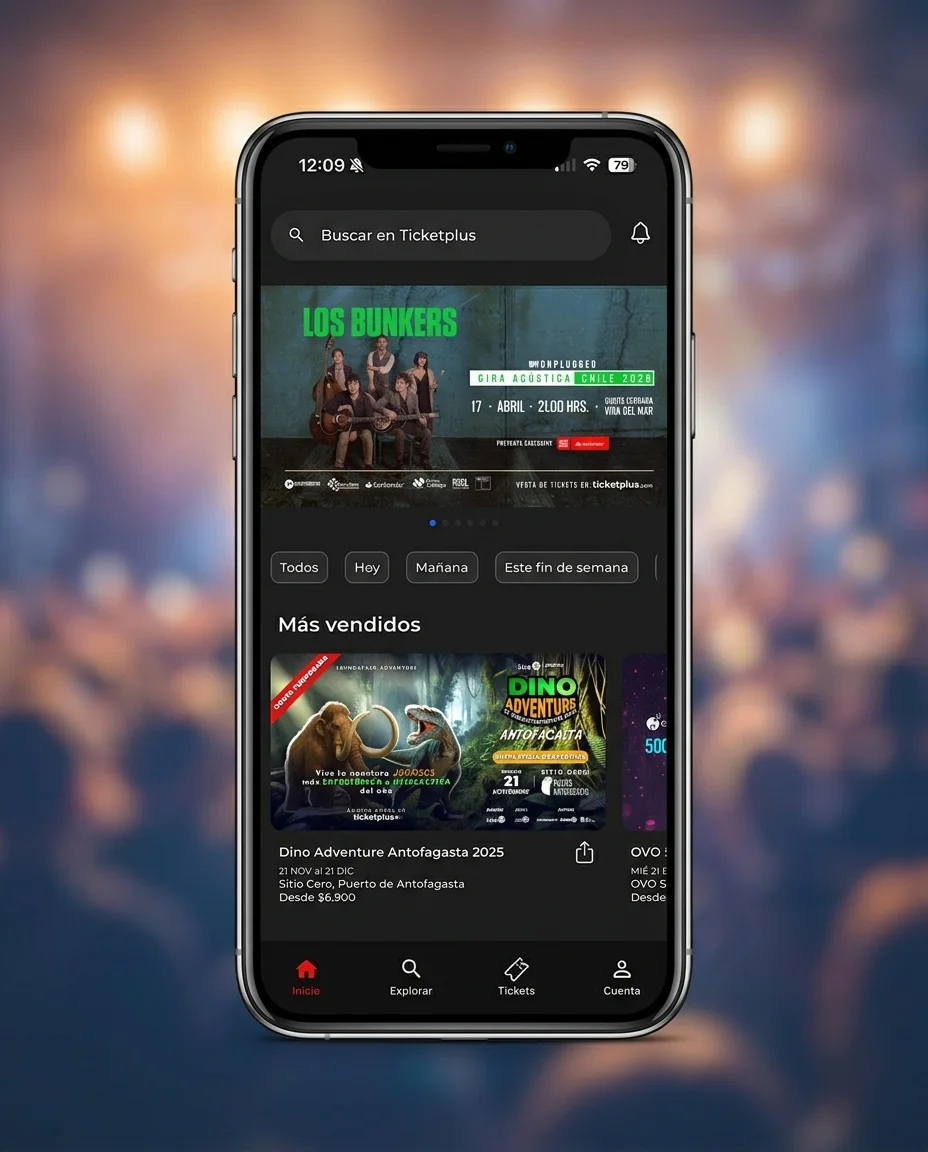
View real-time sales, validate tickets and send comps from iOS and Android. For the producer who needs to watch the launch without opening a laptop.
Total revenue, by ticket type and by channel. Cross-event sales curve, live checkout conversion rate, per-minute sales during launches. End-to-end attribution from click to ticket sold.
Plug into Looker, Tableau or Power BI. Data export for CRM and ERP. If your team doesn't have BI, we build custom dashboards for the KPIs you need to read. The business intelligence layer is yours.
Processing and settlement are configured for the country, payment provider and account agreed for your operation.
Connect the methods enabled for local-currency collection and settlement under the agreed configuration.
Choose a per-ticket fee, a SaaS plan or a prepaid bundle; minimums, terms and scope are defined in the proposal.
Currencies, payment methods, settlement terms and fiscal workflows are enabled according to country and agreed scope.
The difference isn't the number of charts. It's that the data arrives on time, can be trusted, and can be exported.
Reporting workloads are processed without competing with checkout; capacity and refresh targets are sized for each operation.
GA4, UTMs and advertising pixels connected according to each campaign's configuration.
CSV, XLSX, JSON and API access are available according to the agreed formats and scope.
Compare event performance and prepare the next campaign from a shared view.
Let's talk about your reporting
A dashboard demo tailored to your operation. No generic slides.
Our team will review your operation and get in touch.
Form not showing? You can get started now or contact us directly.